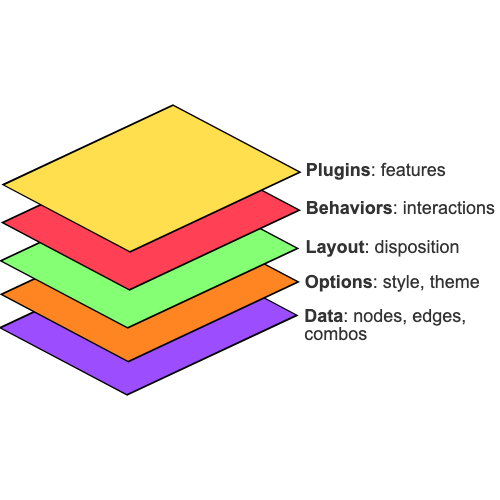
g6R provides R bindings to the G6 graph library. It allows to create interactive network in R, with stunning set of features, including:
- Support for various layouts, such as force-directed, radial, circular, and hierarchical layouts.
- Interactive behaviors like zooming, dragging, and selecting elements.
- Plugins for additional functionality, such as minimaps and tooltips, context menus, and node grouping features like bubble sets, hulls and legends.
- Various data sources including data frames, lists and remote JSON urls.
- Support for combos allowing for nested nodes.
- High performance rendering (>20000 nodes).

shinyAppDir(system.file("examples", "demo", package = "g6R"))Installation
You can install the development version of g6R from GitHub with:
# install.packages("pak")
pak::pak("cynkra/g6R")
Example
To create a g6R graph:
library(g6R)
nodes <- data.frame(id = 1:10)

# Generate random edges
edges <- data.frame(
  source = c(2, 6, 7),
  target = c(1, 3, 9)
)

g6(nodes, edges) |>
  g6_options(
    node = list(
      style = list(
        labelBackground = TRUE,
        labelBackgroundFill = '#FFB6C1',
        labelBackgroundRadius = 4,
        labelFontFamily = 'Arial',
        labelPadding = c(0, 4),
        labelText = JS(
          "(d) => {
            return d.id
        }"
        )
      )
    )
  ) |>
  g6_layout(d3_force_layout()) |>
  g6_behaviors(
    "zoom-canvas",
    drag_element_force(fixed = TRUE),
    click_select(
      multiple = TRUE,
      onClick = JS(
        "(e) => {
            console.log(e);
          }"
      )
    ),
    brush_select(),
    create_edge()
  ) |>
  g6_plugins(
    "minimap",
    "tooltip",
    context_menu()
  )